
Munin centralized monitoring on Centos
Munin is a great tool for performance graphing your servers, by default it will graph resources on localhost, however if you wish to monitor multiple servers from single location, then you must deploy a central Munin server.
Having central graphs mean you can have central hub of data about performance of your systems. This can later be better presented, viewed and analyzed,
Let's begin setting up a central server
To get things started we will need one server for centralized graphs. For start this can be a low budget dedicated server or a small vps, if you have large amount of monitored nodes, and large amout of metrics on them, then you will probably want to invest in better disks. Updating huge amounts of rrd files and regenerating html an graphs can be disk IO intensive with large instalations.
Installing munin
This will be a minimal install for a central munin server. I'm using a small vps with minimal centos 5 install.
First let's setup elrepo:
rpm -Uvh http://download.fedora.redhat.com/pub/epel/5/i386/epel-release-5-3.noarch.rpm
Now we need to install munin and munin-node (if you wish to monitor this host as well):
yum install -y munin munin-node
by default munin will put its html files into /var/www/html/munin folder If you wish to move that to another place, now is your time. For the sake of simplicity I'll just leave it where it is. Of course we will need apache to access munin html files, so if you don't have apache installed do:
yum install -y httpd
now start the apache:
service httpd start
If you left everything as it is munin html should be available at: http://yourhostname.com/munin/ You may notice that there is nothing there yet, just wait until we configure all other hosts. start the munin-node on this host (if you installed it):
service munin-node start
Make sure your cron is runing:
service crond status
and let's go configure those other hosts.
Installing munin-node
Installing on cPanel
Since lot's of my servers to monitor are with cPanel installed there is an easy way to install munin.
Login to your whm go to: Manage plugins, now find Munin, click a check box, scroll down and click save. After the munin is installed it should appear in your whm at the bottom of the navigation. Go and check up if the munin is installed correctly.
Installing trough cPanel will install munin-node and munin, you can disable the munin graphing later if you like.
Installing on non cPanel
We can install munin on Centos trough Elrepo. first we will setup elrepo:
rpm -Uvh http://download.fedora.redhat.com/pub/epel/5/i386/epel-release-5-3.noarch.rpm
and then install a munin-node:
yum install -y munin-node
voila... let's configure nodes on remote servers now.
Configuring munin-node on remote hosts
For both cPanel and non-cPanel servers all we need to do is add allowed host in munin-node.conf:
nano /etc/munin/munin-node.conf
add at the end of the file:
allow ^192\.168\.0\.20$
where 192.168.0.20 is the IP address of you central munin server. restart the munin-node:
service munin-node restart
If you have firewall installed on that host (and I hope you do), allow the incoming tcp port 4949 for the IP of the central node.
In csf add the following line:
tcp:in:d=4949:s=192.168.0.20
to your /etc/csf/csf.allow file
or just run:
iptables -A INPUT -p tcp -s 192.168.0.2 --dport 4949 -m state --state NEW,ESTABLISHED -j ACCEPT
Modify this to your firewall, and don't forget to replace 192.168.0.20 with your munin server IP. Now everything should be ready for data collection from central server
Configuring munin server
We need to configure munin conf file on our central server to collect data from remote servers:
nano /etc/munin/munin.conf
If you didn't change any locations of html files and munin datastore you realy don't need to change that in the conf file.
What we are interested with are the host sections. You will notice there is configuration for our localhost You can change its name now, leave the address field as it is.
To add up a new host just add:
[myhost.mydomain.com]
address 192.168.0.10
use_host_name yes
change the 192.168.0.10 with the IP of the server you wish to monitor. you can now add as many host you like. Make sure that you have enabled outgoing connections on tcp port 4949 on your central munin server. After a while the first results should start to appear.
Configuring multi host display graphs
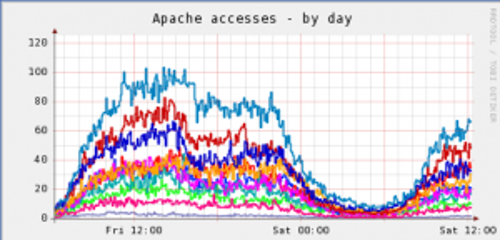
The real benefit of having all the host graphs and data on one place is you can easily make multi host graphs and compare the loads on the servers. This could help you grasp a bigger picture of individual server workloads and give you an idea what to improve and how to load balance between the machines.
Here is one of the example graphs, showing apache request per second. If the machines were the same hardware configuration that would give indications that some of the machines have higher hit rate and we would need to rewrite our load balancing.
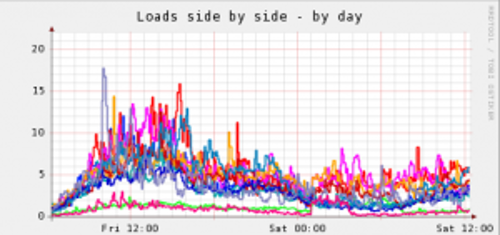
We could do the same thing with load graphs and see which servers have the spikes, and distribute the workload on some less loaded servers.
So how do we configure this?
First you need to find out rrd's name of the data you wish to put on the graph.
for example apache accesses per second:
cd /var/lib/munin/yourdomain.com
ls -lh in the directory and you will find out what data is available to munin. in case of the apache accesses data we will have few files named:
hostname.domainname.com-apache_accesses-accesses80-d.rrd hostname2.domainname.com-apache_accesses-accesses80-d.rrd
what we are interested with are those fields (marked in red) after the domain name separated by dash. Ok let's write a conf in munin.conf for this two hosts:
nano /etc/munin/munin.conf
Go under the host definitions in your conf file and add:
[domainname.com;Totals] update no apacheaccess.graph_title Apache access side by side apacheaccess.graph_order hostname=hostname.domainname.com:apache_accesses.accesses80 hostname1=hostname1.domainname.com.com:apache_accesses.accesses80
Notice the red lines, they are the same as rrd filenames red parts we saw earlier, just replace dash with dot. Green text is to disable updates for this domain declaration since updates are already done at the host declaration in the conf file. Blue is the graph representation name, followed by title in the first line and data in second.
This way you can make all the side by side graphs for all the data munin collected in rrd files. After the changes wait for a next munin update and enjoy the graphs